
Section Exercises
1. Can the average rate of change of a function be constant? 2. If a function is increasing on and decreasing on , then what can be said about the local extremum of on 3. How are the absolute maximum and minimum similar to and different from the local extrema? 4. How does the graph of the absolute value function compare to the graph of the quadratic function, , in terms of increasing and decreasing intervals? For exercises 5–15, find the average rate of change of each function on the interval specified for real numbers or . 5. on 6. on 7. on 8. on 9. on 10. on 11. on 12. on 13. on 14. on 15. given on For exercises 16–17, consider the graph of .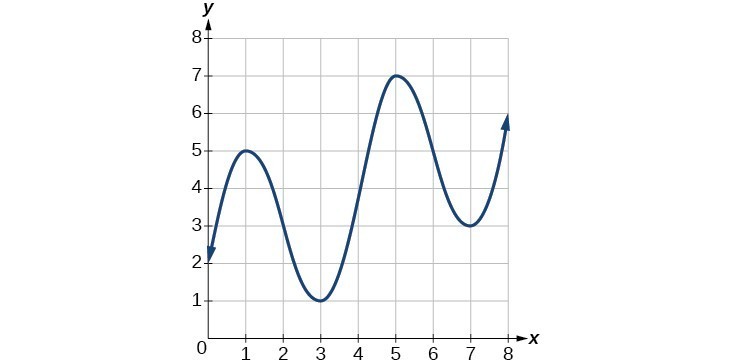 16. Estimate the average rate of change from to .
17. Estimate the average rate of change from to .
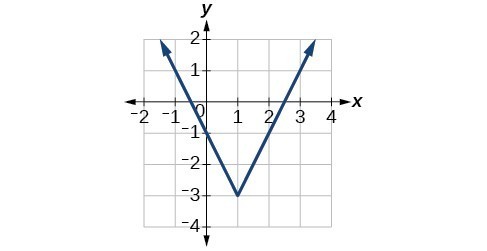
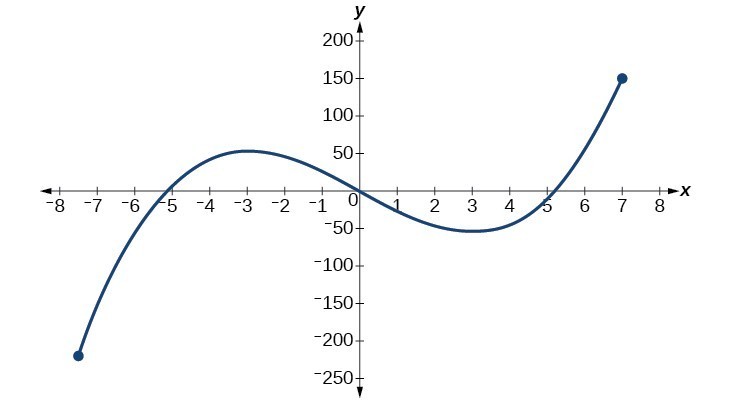
For exercises 18–21, use the graph of each function to estimate the intervals on which the function is increasing or decreasing.
18.
16. Estimate the average rate of change from to .
17. Estimate the average rate of change from to .
For exercises 18–21, use the graph of each function to estimate the intervals on which the function is increasing or decreasing.
18.
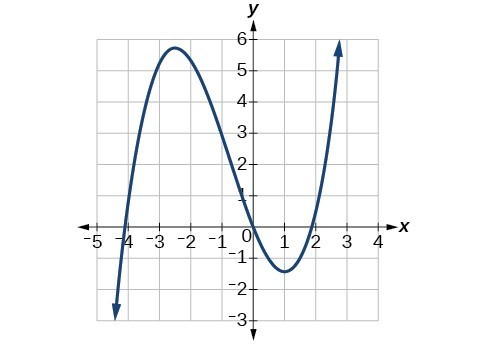
 19.
19.
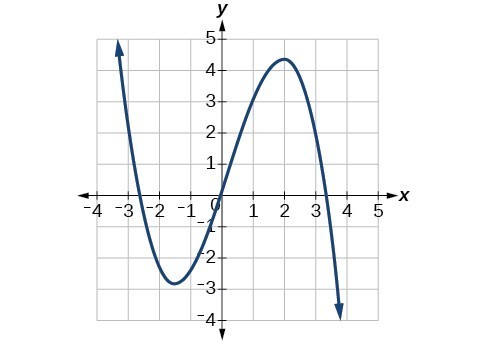
 20.
20.
 21.
21.
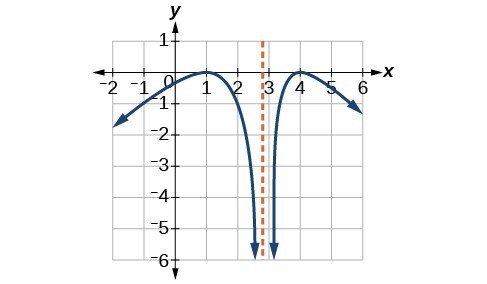 For exercises 22–23, consider the graph shown below.
 22. Estimate the intervals where the function is increasing or decreasing.
23. Estimate the point(s) at which the graph of has a local maximum or a local minimum.
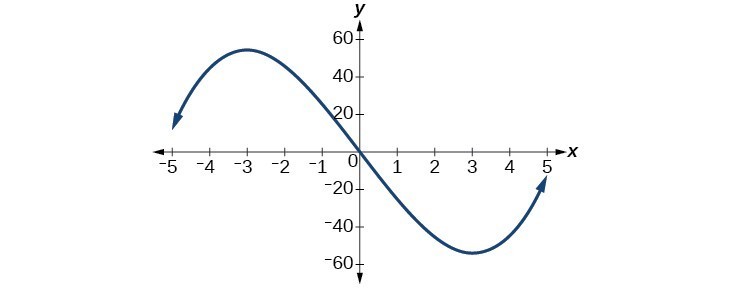
For exercises 24–25, consider the graph below.
22. Estimate the intervals where the function is increasing or decreasing.
23. Estimate the point(s) at which the graph of has a local maximum or a local minimum.
For exercises 24–25, consider the graph below.
 24. If the complete graph of the function is shown, estimate the intervals where the function is increasing or decreasing.
25. If the complete graph of the function is shown, estimate the absolute maximum and absolute minimum.
26. The table below gives the annual sales (in millions of dollars) of a product from 1998 to 2006. What was the average rate of change of annual sales (a) between 2001 and 2002, and (b) between 2001 and 2004?
24. If the complete graph of the function is shown, estimate the intervals where the function is increasing or decreasing.
25. If the complete graph of the function is shown, estimate the absolute maximum and absolute minimum.
26. The table below gives the annual sales (in millions of dollars) of a product from 1998 to 2006. What was the average rate of change of annual sales (a) between 2001 and 2002, and (b) between 2001 and 2004?
| Year | Sales (millions of dollars) |
| 1998 | 201 |
| 1999 | 219 |
| 2000 | 233 |
| 2001 | 243 |
| 2002 | 249 |
| 2003 | 251 |
| 2004 | 249 |
| 2005 | 243 |
| 2006 | 233 |
| Year | Population (thousands) |
| 2000 | 87 |
| 2001 | 84 |
| 2002 | 83 |
| 2003 | 80 |
| 2004 | 77 |
| 2005 | 76 |
| 2006 | 78 |
| 2007 | 81 |
| 2008 | 85 |
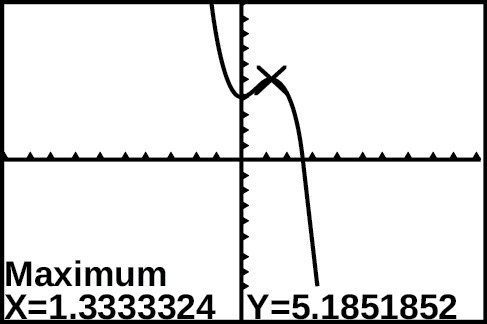 Based on the calculator screenshot, the point is which of the following?
A) a relative (local) maximum of the function
B) the vertex of the function
C) the absolute maximum of the function
D) a zero of the function.
42. Let . Find a number such that the average rate of change of the function on the interval is .
43. Let . Find the number such that the average rate of change of on the interval is .
44. At the start of a trip, the odometer on a car read 21,395. At the end of the trip, 13.5 hours later, the odometer read 22,125. Assume the scale on the odometer is in miles. What is the average speed the car traveled during this trip?
45. A driver of a car stopped at a gas station to fill up his gas tank. He looked at his watch, and the time read exactly 3:40 p.m. At this time, he started pumping gas into the tank. At exactly 3:44, the tank was full and he noticed that he had pumped 10.7 gallons. What is the average rate of flow of the gasoline into the gas tank?
46. Near the surface of the moon, the distance that an object falls is a function of time. It is given by , where is in seconds and is in feet. If an object is dropped from a certain height, find the average velocity of the object from to .
47. The graph below illustrates the decay of a radioactive substance over days.
Based on the calculator screenshot, the point is which of the following?
A) a relative (local) maximum of the function
B) the vertex of the function
C) the absolute maximum of the function
D) a zero of the function.
42. Let . Find a number such that the average rate of change of the function on the interval is .
43. Let . Find the number such that the average rate of change of on the interval is .
44. At the start of a trip, the odometer on a car read 21,395. At the end of the trip, 13.5 hours later, the odometer read 22,125. Assume the scale on the odometer is in miles. What is the average speed the car traveled during this trip?
45. A driver of a car stopped at a gas station to fill up his gas tank. He looked at his watch, and the time read exactly 3:40 p.m. At this time, he started pumping gas into the tank. At exactly 3:44, the tank was full and he noticed that he had pumped 10.7 gallons. What is the average rate of flow of the gasoline into the gas tank?
46. Near the surface of the moon, the distance that an object falls is a function of time. It is given by , where is in seconds and is in feet. If an object is dropped from a certain height, find the average velocity of the object from to .
47. The graph below illustrates the decay of a radioactive substance over days.
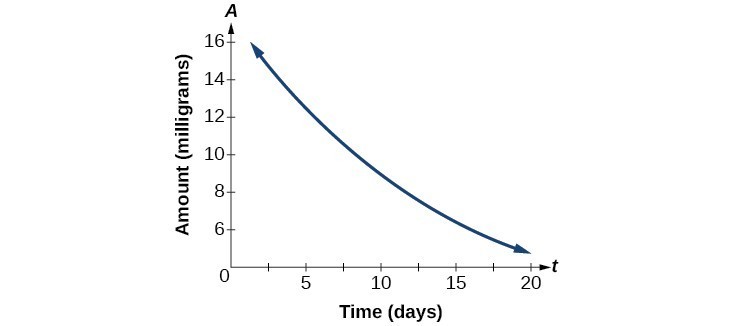 Use the graph to estimate the average decay rate from to .